It is currently Sat Aug 15, 2026 10:12 pm


All times are UTC - 5 hours [ DST ]


Post new topic Reply to topic  [ 3 posts ] 
Author Message
 Post subject: [SOLVED] Discrepancy in histograms?
PostPosted: Thu Dec 29, 2016 5:55 pm  (#1) 
Offline
GimpChat Member

Joined: Sep 29, 2016
Posts: 10
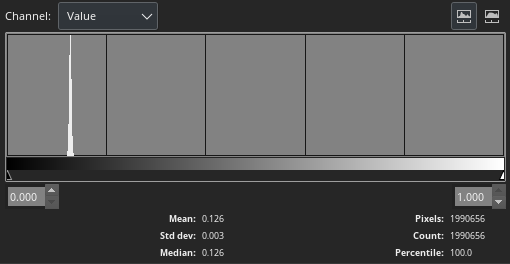
I'm confused about why I'm seeing such different results in histograms in gimp (2.9.5) vs. gmic.

This test image (16bit tiff) shows in the gimp histogram like this:

Image

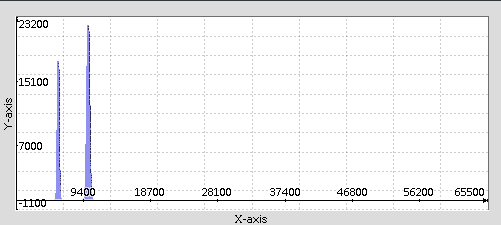
...but in gmic like this:

Image

The gmic version was generated with "gmic histotest.tiff -histogram 65536 -plot 3"

It's not just this image: other images (e.g. an 8bit jpg) also have very different appearances in either histogram. Scaling down the number of histogram "buckets" in gmic doesn't improve the situation.

Any ideas?


Share on Facebook Share on Twitter Share on Orkut Share on Digg Share on MySpace Share on Delicious Share on Technorati
Top
 Post subject: Re: [SOLVED] Discrepancy in histograms?
PostPosted: Thu Dec 29, 2016 7:48 pm  (#2) 
Offline
GimpChat Member

Joined: Sep 29, 2016
Posts: 10
Aha -- apparently gmic calculates the histogram of each channel independently and sums the results, where gimp is showing the Value of each pixel. I assumed gmic was showing Value as well.

Here's gimp's RGB histogram:

Image

...the second bump is lower than gmic just because gimp is overlaying the R and B channels where gmic is summing them.


Top
 Post subject: Re: [SOLVED] Discrepancy in histograms?
PostPosted: Fri Dec 30, 2016 3:36 am  (#3) 
Offline
GimpChat Member
User avatar

Joined: Jan 03, 2011
Posts: 1656
Hello ollo,

G'MIC -histogram command is indeed quite 'dumb' in the sense that it just loops over all available image values you send, and count the number of times each value appear in the image buffer. So if you feed it with a RGB image as input, the histogram will count a value without regarding if this is a R,G or B value.
But this is actually more a feature than a bug, because it allows to be very flexible in the way histograms can be computed.
For instance, computing the histograms for all 3 RGB channels independently can be done with :

$ gmic RGB.jpg -split c -histogram 256 -append c -plot 3

Now, if you want the histogram only for the value :

$ gmic RGB.jpg -rgb2hsv -channels 2 -histogram 256 -plot 3

Same if you want the histogram for the lightness :

$ gmic RGB.jpg -rgb2lab -channels 0 -histogram 256 -plot 3

and so on...


Top
Post new topic Reply to topic  [ 3 posts ] 

All times are UTC - 5 hours [ DST ]


* Login  


Powered by phpBB3 © phpBB Group